Topics
- Article
Improving Heart Rate Accuracy: Your WHOOP is Getting Smarter!

Here at WHOOP, we are constantly working towards bettering our ability to optimize athlete performance. Part of that is a commitment to deliver the best heart rate accuracy under any condition–whether it be sleeping, walking, running, swimming, cycling, lifting weights, playing NFL football, or any of the other numerous activities that make up the daily lives of our athletes. To keep up with this challenge, our patented heart rate calculation algorithm is continuously evolving.
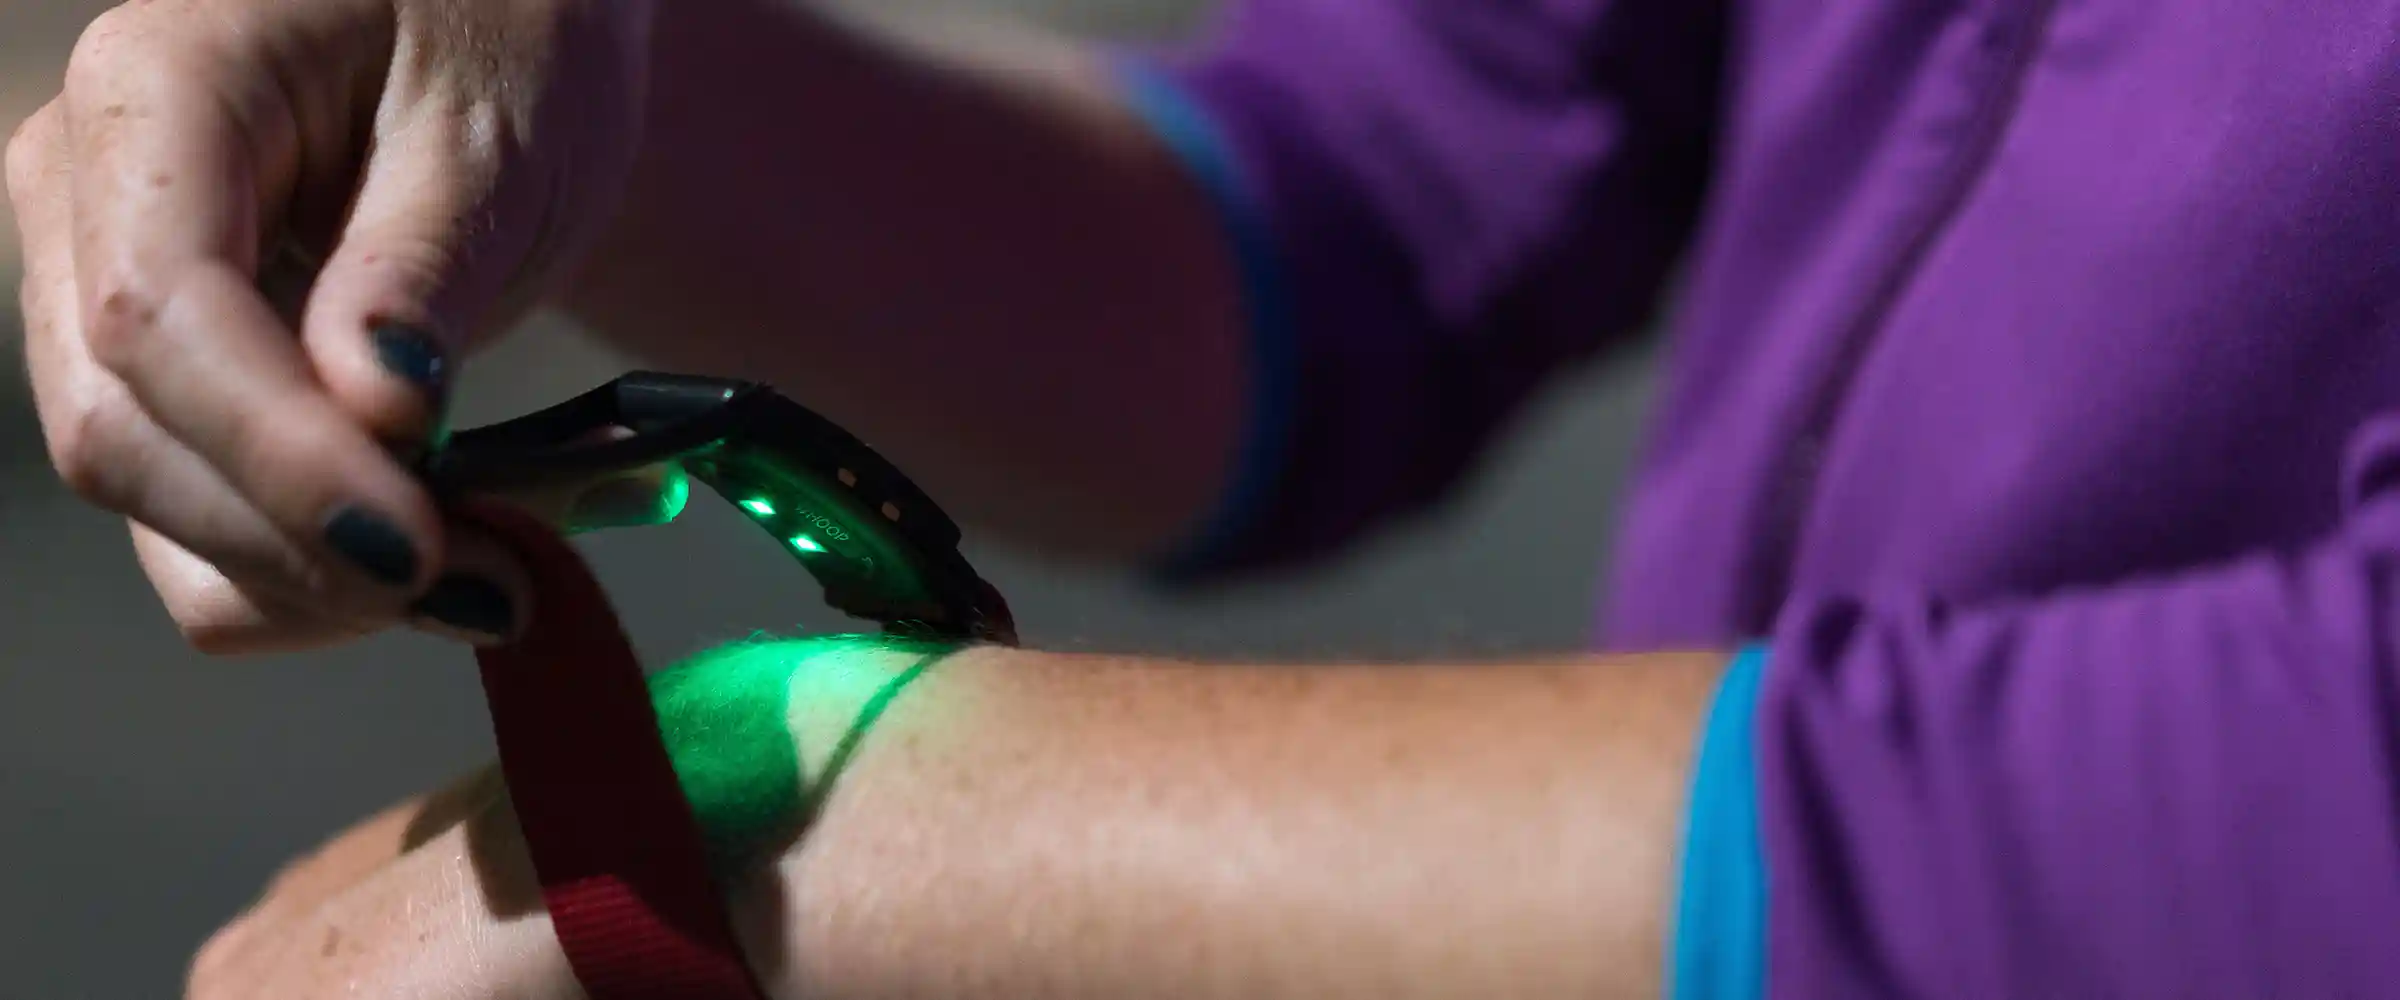
The goal is to diminish the impact of movement and other noise on the heart rate signal. In general, it is much more difficult to calculate heart rate via photoplethysmography (the technology behind the green lights on the bottom of your Strap) when the body is moving than when it is at rest. Our algorithm processes the massive amount of data we collect from our sensors, effectively removing the noise from the signal. This forms the foundation for the Strain, Sleep and Recovery analysis that WHOOP provides.
The WHOOP heart-rate algorithm uses advanced techniques from digital signal processing and statistical inference. There is a lot of data to make sense of and many different ways the noise can corrupt the signal. To get around this, we use multiple concurrent estimators, where each optimizes the likelihood of heart rate accuracy for a given context. We are then able to pick and choose the estimates that maximize the likelihood of accurately determining your heart rate at any given time.
Basically, WHOOP is constantly estimating your heart rate in a variety a different ways. This allows for it to be accurate under all conditions, ranging from sleep to high-intensity workouts. The graph presented below, known as a spectrogram, gives an inside look into how our sensors “see” the heart rate data. The example specifically shows how WHOOP can keep up with interval training through phases of high-intensity and low-intensity activity.

Figure 1, optical signal spectrogram: The normalized amplitude of each frequency (0-200 BPM) vs time. The color scale is from dark green (0) to bright yellow (1). The yellow traces in the plot represent the heart rate candidates at any time. The dash line represents the true heart rate.
Data-Driven Machine Learning in Heart Rate Calculation
The latest version of the WHOOP heart rate calculation algorithm now incorporates data-driven machine learning to improve its accuracy. In order to train your WHOOP, we used an enormous dataset consisting of thousands of hours of recording spanning various workouts from diverse subjects. And this is just a start–the more data that is collected with WHOOP, the smarter your WHOOP will become.
By employing a data-driven method, each heart rate estimator is now optimized for the best performance use in certain conditions: Sleep, low-intensity activity, regular activity like running, high-intensity activity like CrossFit, etc. Every second, the WHOOP machine-learning engine evaluates more than 250 parameters (movement, acceleration, skin conductance, ambient light, etc.) to determine your most likely heart rate.

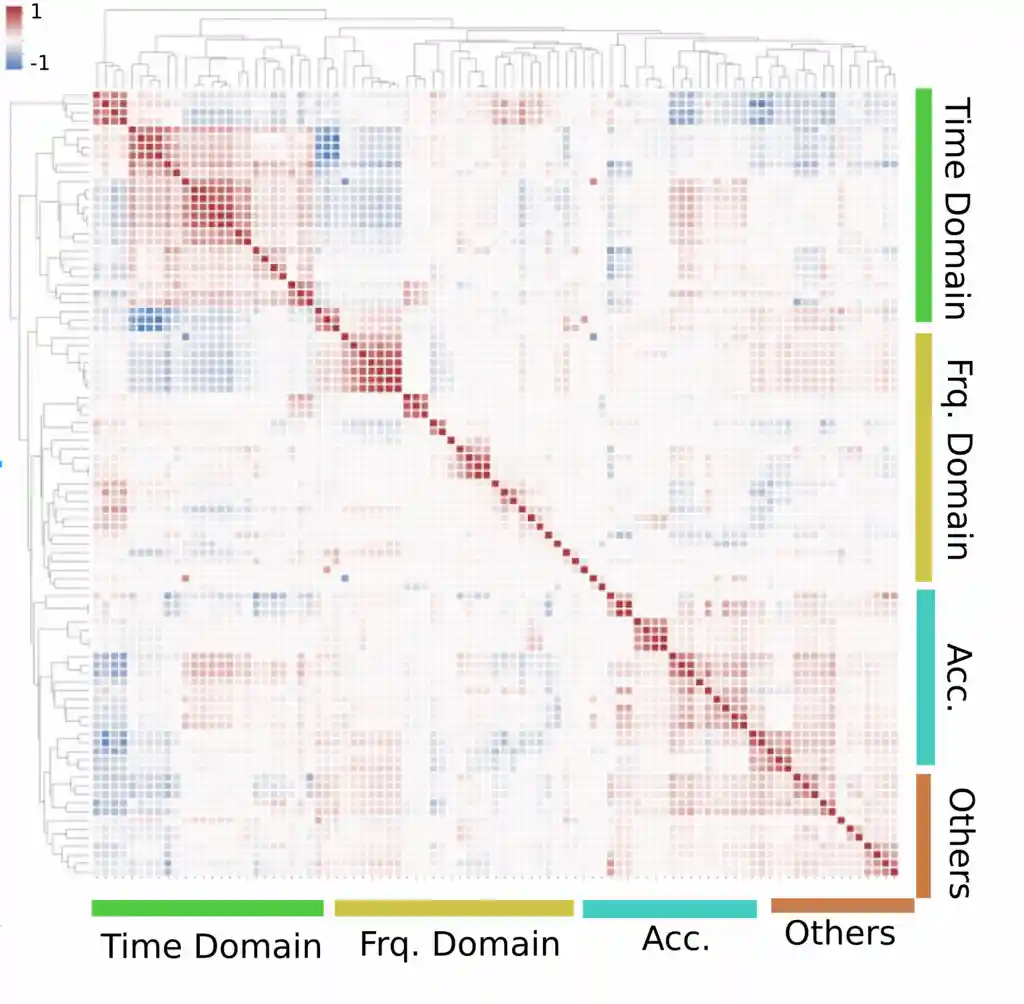
Figure 2: The correlation matrix of the 250 features calculated each second to estimate the most probable heart rate. Each square represents the correlation between two of the 250 features used to assess heart rate.The correlation value is between -1 (dark blue, or completely anti-correlated values) to 1 (dark red, completely correlated values). The trees on left and top of the graph represent the clustering of all 250 features. The closer two features are, the closer they cluster together and are put into the same subtree. Each subtree represents features calculated from time domain, frequency domain, accelerometer and physiological values.
The above figure displays the complexity and diversity of the features used at any time for heart rate estimation. This is illustrated by the fact that no two features are completely similar or correlated. Additionally, the fact that all the rows and columns are unique shows the tremendous variety of complex scenarios and conditions in our analysis. By using the information encoded in all of these features, we can help eliminate the occasional outliers in reported heart rate data.
We hope you’ve enjoyed this inside look at the complexities involved in getting you accurate heart rate information. The improvements we have made over time have been substantial and we are looking forward to continuing to develop our algorithms as we further learn from the data. Please let us know if you have feedback or questions, we rely on our users to help us prioritize which areas to research next!